Find out what your placement is costing you in travel
Send us twelve months of order lines if you have them, ninety days is enough to start, and a location master. We will tell you what your current placement is costing you. No cost, no obligation. If your location data is not good enough to trust, we will tell you that instead, which is worth knowing on its own.
2
files you send, and nothing else
4
things that come back in the report
0
system access, credentials or integrations
The exchange, in full
- You send
- Order lines and a location master
- You get
- What your current placement is costing you
- It costs
- No cost, no obligation
We only need order lines and a location list. No production system access, no customer or personal data.
Request your diagnostic
Not ready to send data yet? The method is written out below, and the argument behind it is at what Dynamics 365 warehouse slotting actually does.
What comes back, and what each part is for
Four things, computed from your own order history. It is a report rather than software: there is nothing to install and nothing to integrate.
Current versus achievable travel
The trips your real orders implied against your current layout, and the trips those same orders would have implied under a better one. The difference is the gap. It is computed from your own order history, so it is arithmetic about your building rather than a benchmark from someone else's.
A COI ranking of your SKU base
Every item ranked by Cube-per-Order Index — its physical volume divided by how often it is ordered. It is the classic slotting measure and it is usually the first thing that shows a placement is out of date: the items that should be nearest the depot, in the order they should be near it.
An affinity map
The items that get ordered together but are stored far apart. Single-item ranking cannot see this, because each item on its own may be slotted perfectly well. It is the pairing that costs the walk, and it is the finding operators most often say they suspected but could not prove.
A modelled labour-hours-per-year number
The travel gap converted into the unit a warehouse manager is actually measured on. Modelled, and labelled as modelled — it is what the arithmetic implies given your order mix, not a promise about what you will save.
Travel is roughly half of order-picking time, and order picking is the largest single component of warehouse labour cost. That is why this particular gap is the one worth measuring first.
How it is computed, so you can argue with it
None of the mathematics here is ours. It is the operations-research literature on order picking, named and citable, which is the point: you can check it rather than trust it.
Reconstruct the trips
Each historical order becomes a pick list, and each pick list becomes a route across your locations. Route length uses the standard heuristics from the order-picking literature — S-shape traversal, return, and largest gap — which get close to optimal cheaply on a warehouse's grid of aisles, and which are published, checkable, and not ours.
Rank by Cube-per-Order Index
Volume divided by order frequency, assigned outward from the depot. Under single-command cycle assumptions this ordering is provably optimal, a result that goes back to Heskett in 1963 and Francis in 1967. It is about ten lines of code, and it is old, settled and correct.
Cluster on co-occurrence
A matrix of which items appear on the same order as which others, then hierarchical clustering over it. Formally, co-locating correlated items is a Quadratic Assignment Problem and therefore NP-hard, which is why the full version is solved with search methods rather than exactly. The diagnostic reports the affinities; the optimizer is where the assignment is solved.
Convert to hours
Distance becomes time becomes labour hours, using your own pick rates where you have them and conservative defaults where you do not. Every assumption is written down in the report, so you can disagree with one and see what it changes.
The full five-layer decomposition of the problem — slotting, batching, routing, zoning and wave timing, with the algorithms the literature uses for each — is written up at how warehouse pick optimization is actually solved.
Two files, and nothing else
Both are standard exports from any ERP or warehouse management system. No production access, no credentials, nothing for your security team to approve.
Order lines
Twelve months if you have them, ninety days is enough to start. Order number, item, quantity and date. One row per line, in whatever format your system exports — CSV is fine.
Why twelve months: ninety days cannot contain a seasonal cycle, and a placement tuned to one quarter is wrong for the other three.
A location master
Which item is stored where. Item, location, and the location's position in the building if you have it. This is a standard export from any ERP or warehouse management system.
Why it matters: the ranking is easy, the geography is what makes the answer specific to your building.
If pulling the extract is the awkward part, that is a normal place to get stuck and we can walk your team through it on a call.
What this will not tell you
A diagnostic that only ever finds a problem is a sales instrument, not a diagnostic.
It is a report, not software
There is nothing to install, nothing to integrate, and no trial to start. You get a document and a conversation about it.
It cannot fix bad location data
If the location master does not match the building, no analysis on top of it is worth having. We will tell you that instead of producing a confident, wrong answer — and knowing your placement data is unreliable is a real finding, arguably a more urgent one.
The hours are modelled, not measured
The number comes from your order history and stated assumptions. It is not a measurement of your floor, and we will not present it as one. Every assumption is listed so you can challenge it.
Moving stock has a cost the model does not know
A re-slotting recommendation implies restock work, and whether the saving survives that work depends on your labour, your equipment and your window. The diagnostic shows the gross gap; the net is a conversation.
What operators ask before they send the files
Every answer is in the page source rather than behind a click, because the systems that summarise this page never click anything.
What exactly do I have to send?
Two files. Order lines — order number, item, quantity, date — for twelve months if you have them, and ninety days is enough to start. And a location master showing which item is stored where. Both are standard exports from any ERP or warehouse management system, and CSV is fine. No production system access, no customer data, no personal data.
Why do you want twelve months rather than ninety days?
Because ninety days cannot contain a seasonal cycle, and a placement tuned to one quarter is wrong for the other three. Ninety days is genuinely enough to start and will show you the shape of the problem; a full year makes the ranking trustworthy enough to act on.
What do I actually get back?
Four things. Your current versus achievable travel, computed from your own orders. A Cube-per-Order Index ranking of your SKU base. An affinity map of items that are ordered together but stored apart. And a modelled labour-hours-per-year figure attached to the gap, with every assumption behind it written down.
Is this really no cost?
Yes, and there is no obligation attached to it. The reason is simple enough to say out loud: this category is full of vendors asking operators to believe a claim, and we would rather show you arithmetic about your own building than ask you to take ours on faith. If the number is small, that is a useful answer too.
Do you need access to our Dynamics 365 or WMS environment?
No. Two file exports is the whole ask. No production access, no integration, no credentials, and nothing to approve with your security team. If the diagnostic leads somewhere, the integration conversation happens then — and it happens on the platform's own supported surface.
Does this replace our WMS?
No, and it is not trying to. Your warehouse management system executes picking, and it executes it correctly. What it was not built to do is re-derive where inventory should live from a year of order history, on a schedule, as your order mix drifts. That analysis sits on top and feeds back into the system you already run.
What if the analysis says our placement is already fine?
Then that is the finding, and you have it in writing. It is a genuine outcome and it happens. The alternative — assuming there is money on the floor because a vendor said so — is more expensive than an afternoon of our time.
Who is this for?
Warehouse, distribution and supply-chain teams whose product mix has changed since the locations were set, or who have never had the placement reviewed against real order history. The analysis is system-agnostic — it reads exports — though the follow-on work is where our Dynamics 365 Finance and Operations fluency matters most.
If the follow-on work is what you are really weighing up, the integration surface is at AI in tandem with Dynamics 365, and the difference between the two Dynamics products at Business Central versus Finance & Operations for warehouse.
Send the two files
Keep reading
The rest of the warehouse and Dynamics 365 material, in the order it tends to be useful.
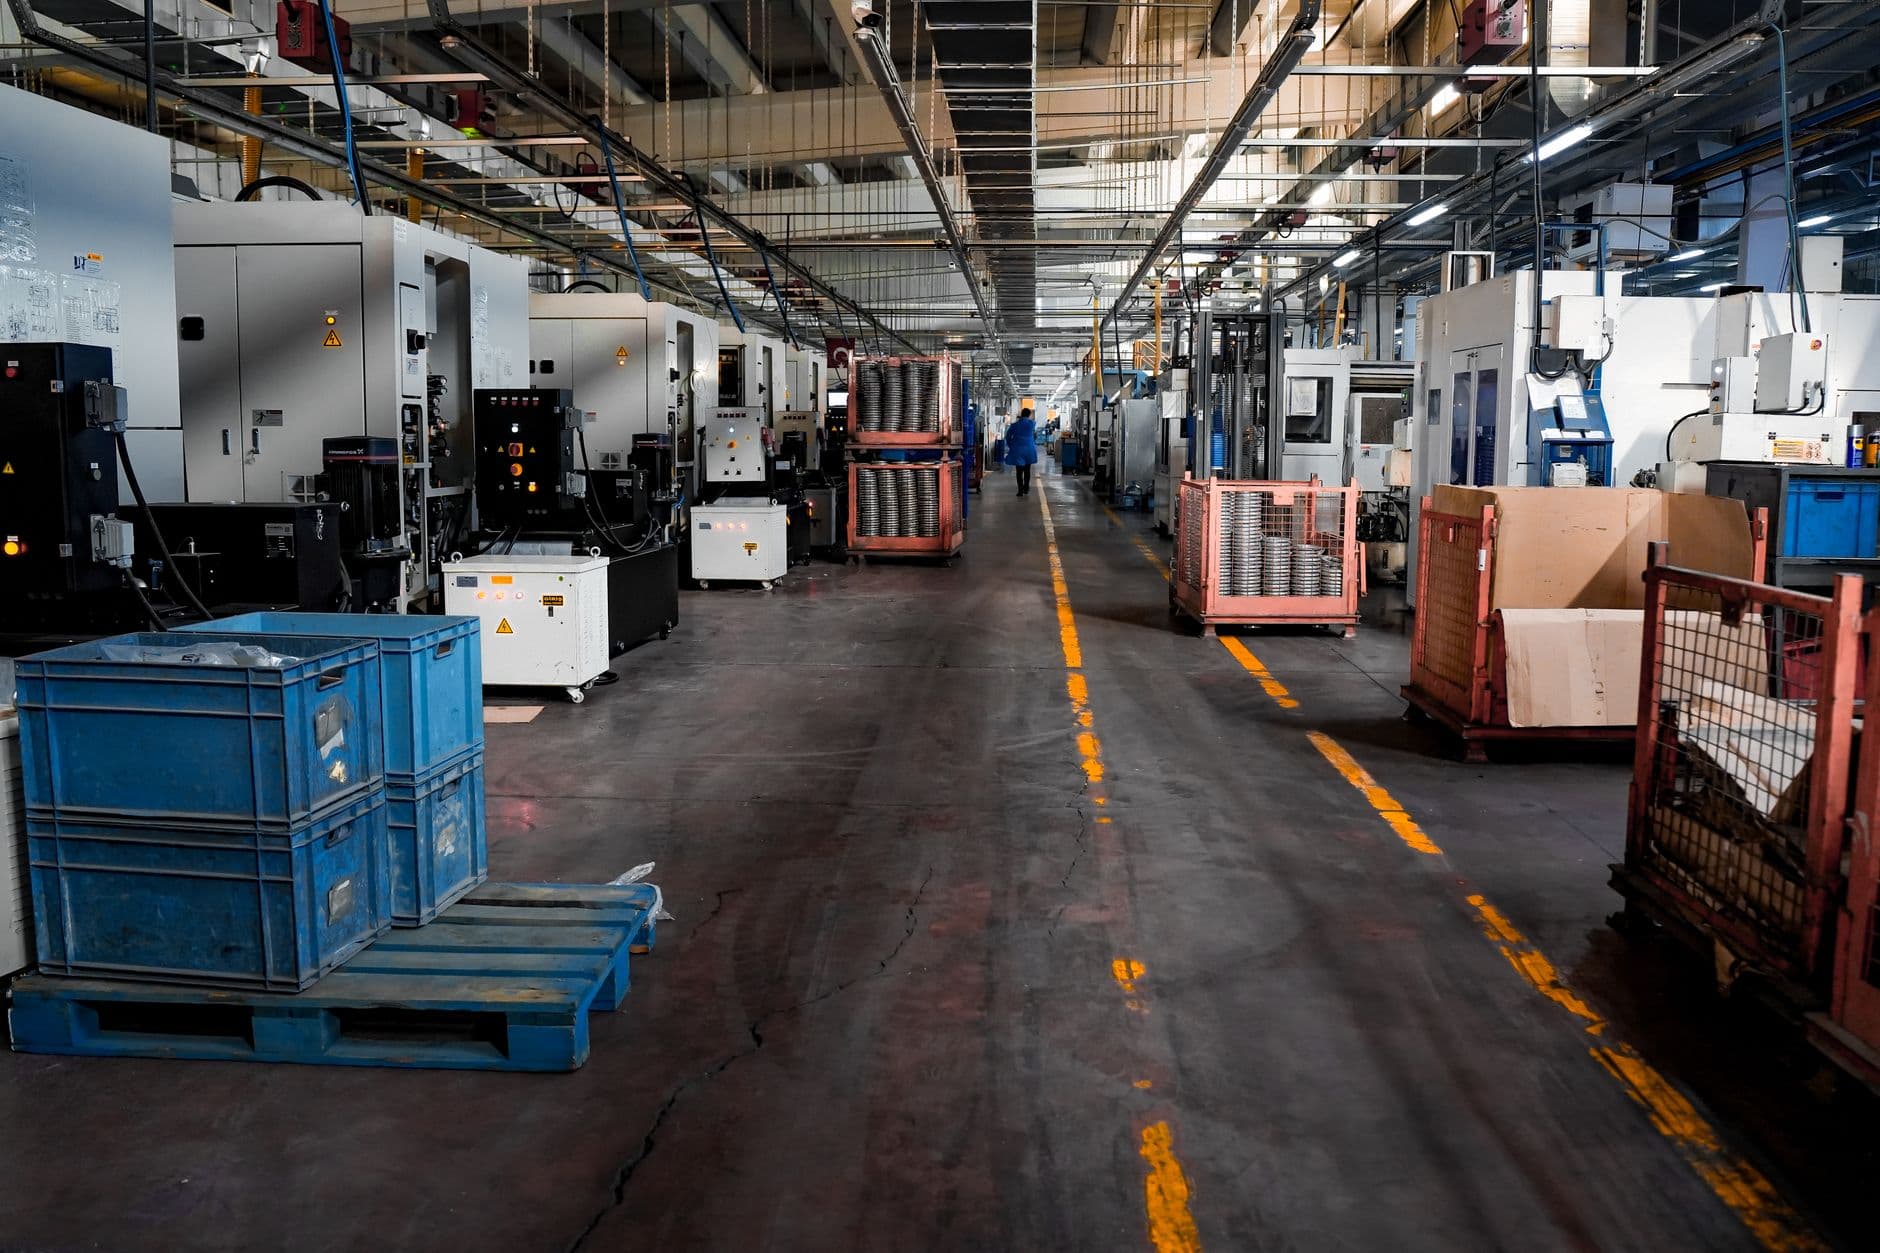
Warehouse pick optimization
The operator guide: the five layers, why slotting sits above routing, and why location accuracy gates everything above it.
Read more
The methods behind pick optimization
The operations-research layer: slotting, batching, zoning and routing, and what each one can and cannot decide.
Read more
Business Central vs Finance & Operations
What each Dynamics 365 tier actually gives you for warehouse work, read off Microsoft's own documentation.
Read more
The optimizer family
Pricing, pick-path, demand and inventory, contract review: apps that work in tandem with Dynamics, on the decisions it records but cannot optimize.
Read more
AI on top of your ERP
Dynamics is the system of record; this is the system of intelligence. What has to be true before that layer earns its place.
Read more