TL;DR
You gave the agents brakes in the last chapter. Brakes stop a runaway, but they do not tell you which agent is dragging, what a run costs, or why last night's batch tripled. Most multi-agent systems ship to production as a black box: the team can see that a run happened and returned, and nothing in between. Worse, agent failures are silent, they return a 200 OK with a confident wrong answer, so uptime and error rate read green while the output is wrong. This chapter builds the instrument panel: the trace tree as the unit of observability, per-span cost attribution that finds the one agent owning two-thirds of the bill, structural sampling that keeps every run worth investigating, and continuous semantic evaluation, the only signal that catches a wrong answer no system metric will flag. Brakes stop a runaway. Instruments show it coming.
A broken microservice returns a 500. A broken agent returns a 200 and a confident wrong answer. Your dashboard stays green while the system is wrong, because you are watching the wrong signal.
In the last chapter we gave the system brakes: a hard budget, a termination predicate, loop detection. Brakes stop a runaway once it starts. They do not tell you one is coming, which agent is dragging, or why last night's batch cost triple what it should have. For that you need instruments, and most multi-agent systems ship to production with none. The team can see that a run happened and that it returned. Everything between the request and the response is a black box.
That gap is what turns a working demo into a production system nobody can operate. The problem is not that agents are wrong more often in production. It is that when they are wrong, nothing tells you. A single model call is trivially observable: one input, one output, one number for tokens. Wrap it in a loop of agents calling tools that call sub-agents, and the run becomes a tree of decisions with no single request boundary, spread across processes, each logging to its own silo. You cannot operate what you cannot see, and by default you cannot see any of it.
TL;DR
Standard observability was built for systems that fail loudly, with an error code. Agent systems fail silently: they return successfully with a wrong answer, so uptime, error rate, and latency all read green while the output is garbage. The unit of agent observability is not the log line, it is the trace tree: one run decomposed into spans, agent turns, model calls, tool calls, and sub-agent hand-offs, each carrying its tokens, latency, cost, model, and the actual prompt and completion. Production observability has to answer four questions the black box hides: who spent the tokens, where the run went wrong, whether this run looks like a healthy one, and whether the brakes tripped and why. The fixes are per-span cost attribution, trace-context propagation across every agent boundary, structural sampling that keeps 100 percent of the runs worth investigating, and continuous semantic evaluation on a sample, because the silent wrong answer is invisible to every system metric you already have. Brakes stop a runaway. Instruments are how you see it coming.
A broken agent returns 200 OK
In a microservice, a failure is loud. An exception is a stack trace, a broken dependency is a 500, a slow query is a latency spike, and an alert fires on all three. The entire discipline of application monitoring assumes failures are loud and discrete, and it is very good at catching them. Agents violate that assumption at the root. When an extraction agent reads the wrong field, when a router sends the task to the wrong specialist, when a reviewer rubber-stamps a hallucination, the HTTP status is 200, the latency is normal, and the token count is unremarkable. A service can report perfect availability and still be wrong on one request in seven, and every metric on your existing dashboard will be green the whole time. The failure lives in the meaning of the output, and meaning does not show up in a status code. So the first thing to internalize about running agents in production: "the system is up" and "the system is correct" are different questions, and every tool you already own answers only the first.
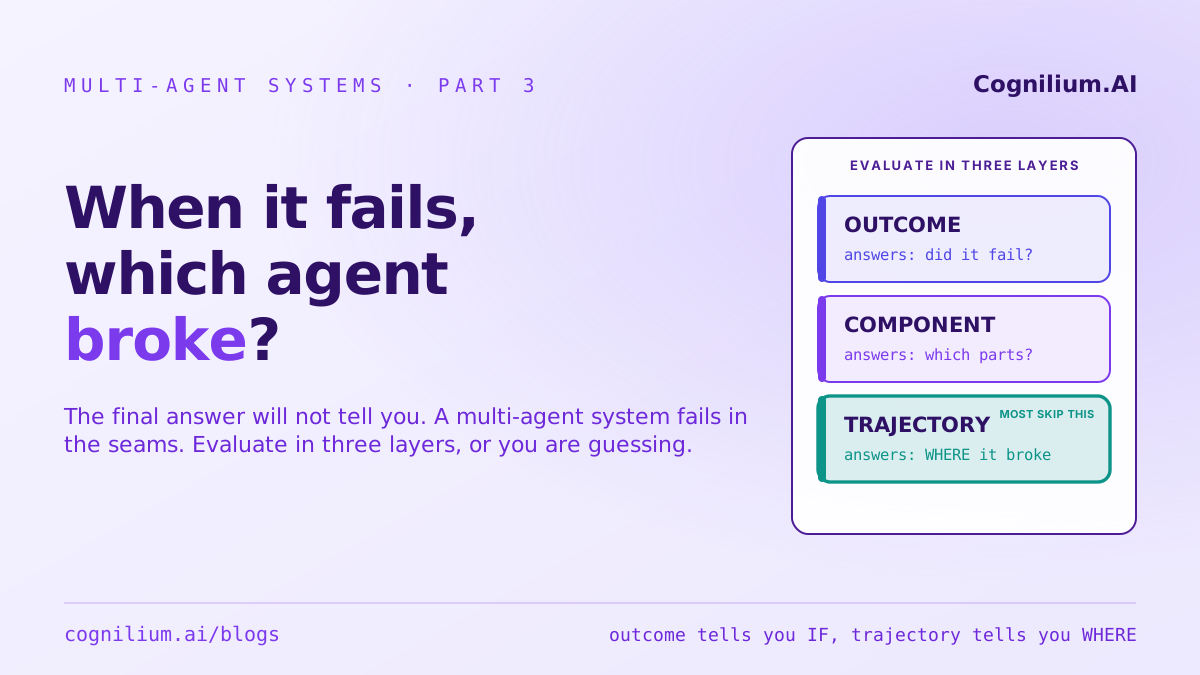
The second-order problem is that even once you suspect an answer was wrong, you usually cannot reconstruct why. Chapter two asked which agent broke, and answered it in development, with a repro you could run on demand. Production does not hand you a repro. The user will not retype the input, and if they did, the run is non-deterministic and would not repeat. The only artifact of what actually happened is whatever you recorded while it was happening. If all you logged was a start time, an end time, and a final answer, you have nothing to debug with. The trace is the repro. If you did not capture it, the failure is simply gone, and you are left telling a client you cannot explain the output your system produced for them.
The unit of observability is the trace, not the log line
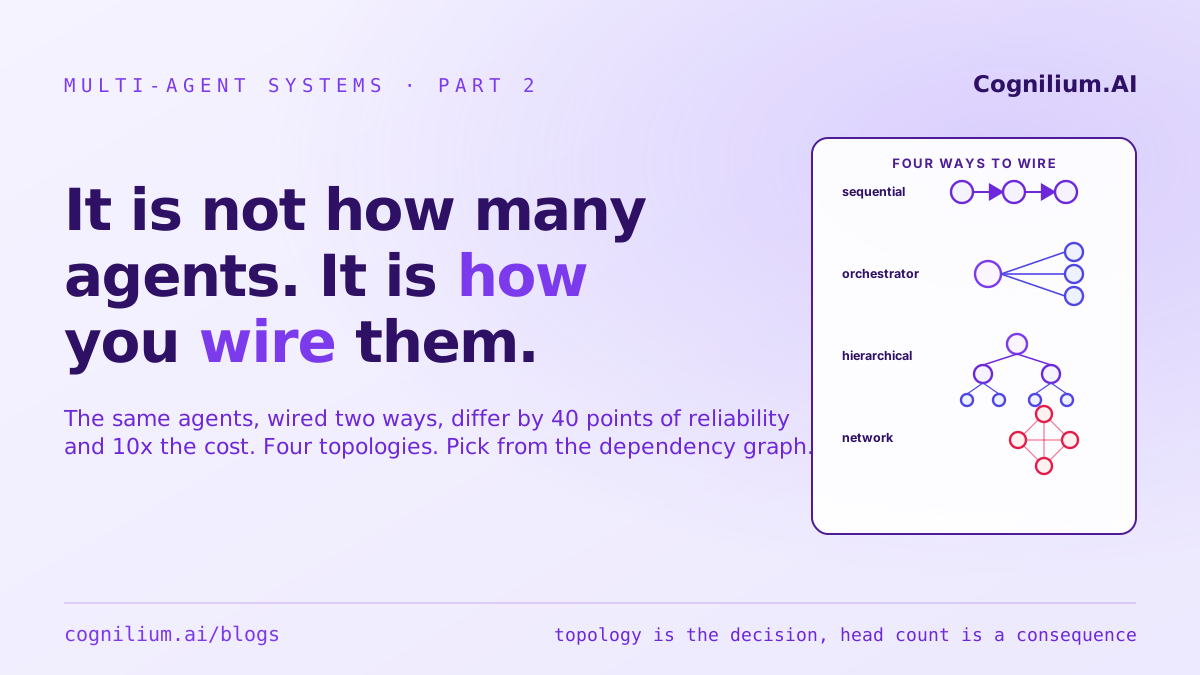
A run is a tree, and that shape is the whole game. The root span is the run itself. Its children are the agent turns. Each turn's children are the individual model calls and tool calls it made. Where an agent delegates, the sub-agent's entire subtree hangs off the delegating span. This is the wiring from chapter one made visible at runtime: the boxes and arrows you drew on the whiteboard are the nodes and edges of the trace. OpenTelemetry's semantic conventions for generative AI exist precisely to standardize this, so that a span for a model call has agreed-on fields for the model name, the token counts, the prompt, and the completion, and any tool that speaks the convention can read your traces without a custom parser.
What each span must carry is where most homegrown logging quietly falls short. Latency and status are not enough. Every span needs the input tokens, the output tokens, the model, the tool name and arguments where relevant, a computed dollar cost, and, non-negotiably, the semantic payload: the actual prompt that was sent and the actual text that came back. The tokens tell you what the step cost. The payload tells you why it did what it did. Drop the payload to save storage and you are back to a black box with nicer charts on the outside.
None of this survives without propagation. The tree only exists if the trace context, the run's identifier, travels with the task across every hand-off. The moment agent A calls agent B in a different process or service without passing that identifier along, B's spans detach into their own orphan trace, and your one run shatters into five disconnected logs that you now have to stitch back together by timestamp and hope. Propagating trace context across agent boundaries is the single most common thing teams get wrong, and it is the entire difference between one readable tree and a pile of shards.
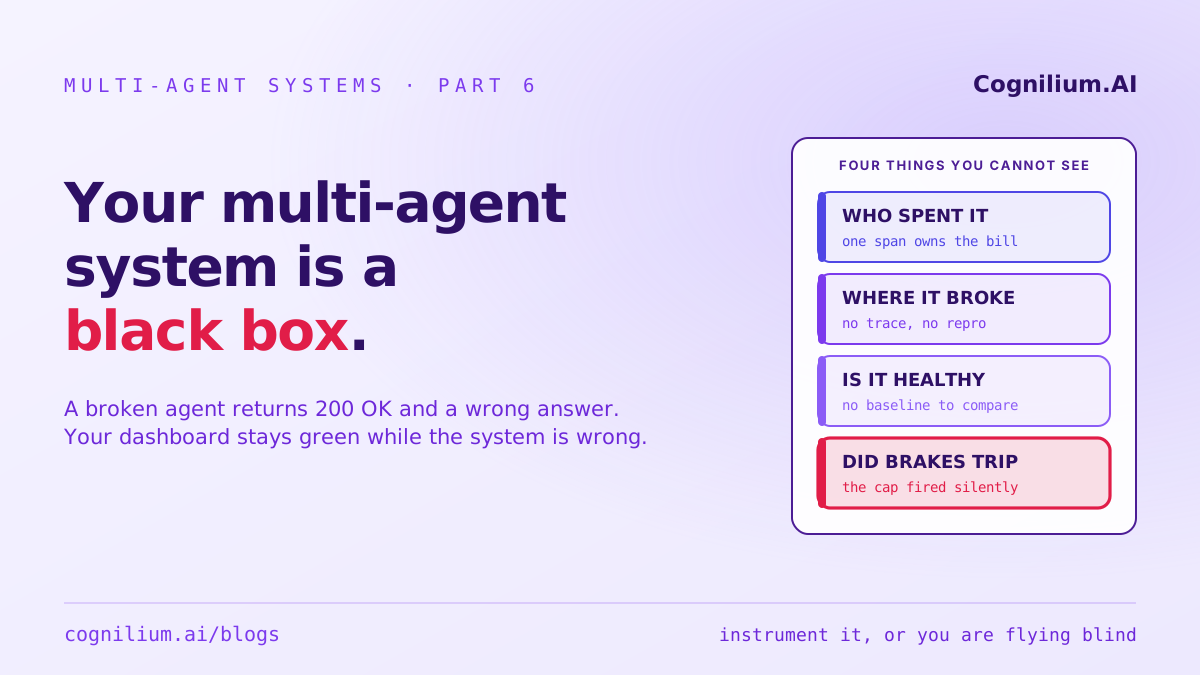
Four questions the black box hides
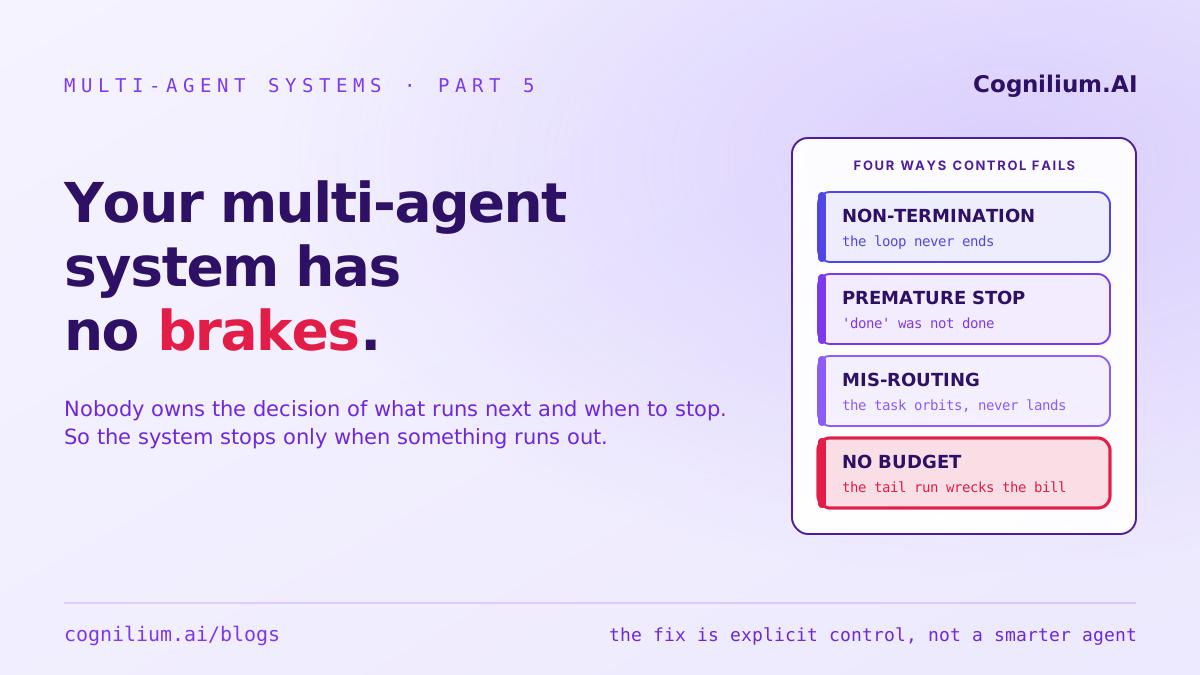
Chapter four listed four ways control fails without a controller. Production has a matching set of four questions you must be able to answer on demand, and each one maps to a specific instrument.
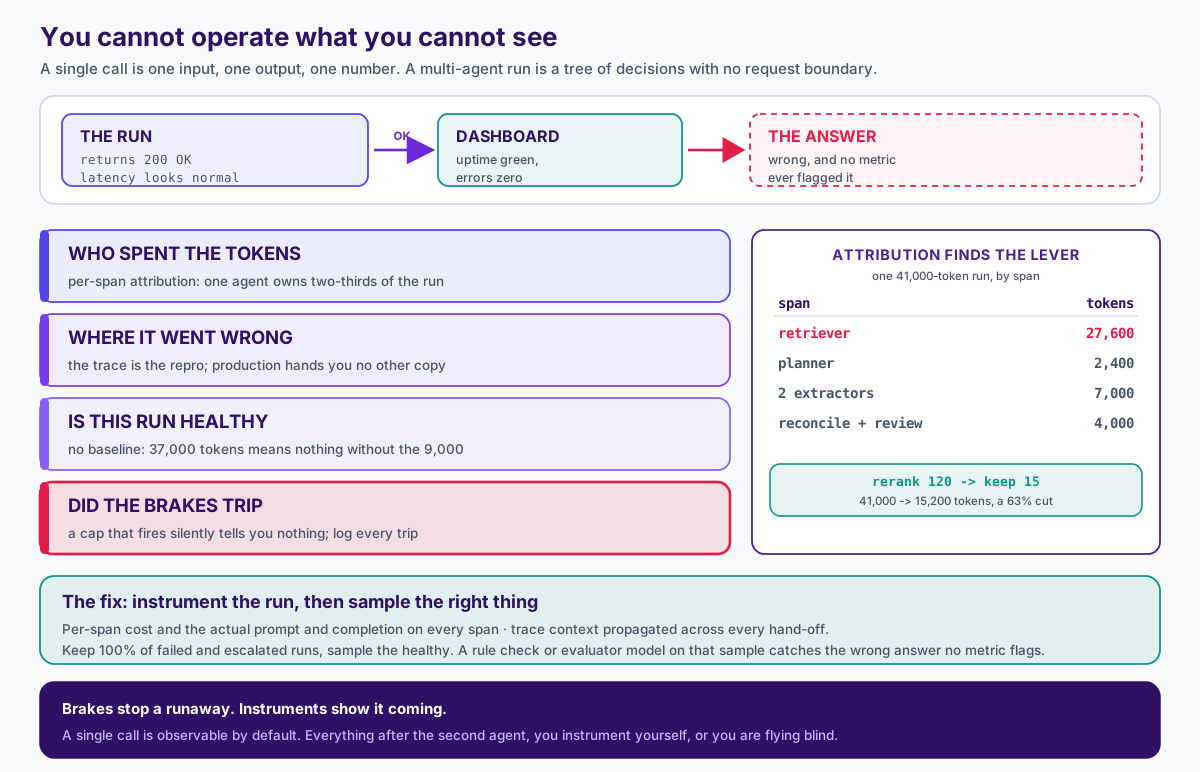
Who spent the tokens? Per-span cost attribution. A run's total cost is nearly useless for optimization, because you cannot act on an aggregate. You need the cost broken down by agent and by call, and once you have it, the distribution is almost always lopsided: one agent, usually a retriever or some other context-stuffing step, dominates, and everything else is a rounding error. You will not find that lever by staring at a single number for the whole run.
Where did it actually go wrong? Root cause on a real run. This is chapter two's question relocated to production, and the trace is what makes it answerable at all. With the payload on every span you can walk the tree, find the step where the shared state first went wrong, and read the exact prompt and completion that produced the error. Without the trace, you are guessing which of six agents to blame, and you are guessing with no evidence.
Is this run like a healthy one? Baseline and drift. You cannot judge a single run in isolation, because "37,000 tokens" means nothing until you know the median is 9,000. You need a recorded baseline of what healthy looks like, per-run token and step distributions, the routing paths, the tool-call counts, so that an anomaly, a run at four times the median step count or a routing path no healthy run ever takes, is visible while it is happening rather than on next month's invoice.
Did the brakes trip, and why? This closes the loop with chapter four's control system. A budget cap or a loop detector that fires silently is nearly as bad as no cap at all, because you never learn which runs are hitting it or what drove them there. Every budget trip, every caught loop, every escalation has to be recorded as an event, attached to the trace that caused it. The brakes and the instruments are the same wiring: the state hash you compute for loop detection is a field you also write onto the span.
Do the math on attribution
Put numbers on the first question, because attribution is the instrument that pays for the whole apparatus. Take a document-extraction run, six agents, one turn each, no loop, that costs about 41,000 input tokens. As an aggregate that is one unremarkable line. Attributed by span, it reads very differently: the retriever, which pulls candidate chunks from the vector store and stuffs them into the prompt, is about 27,600 tokens, roughly two-thirds of the entire run; the planner is 2,400; two extraction workers are 3,500 each; a reconciler and a reviewer are 2,000 apiece. One span is 67 percent of the bill, and you could not see it until you broke the run apart.
Now you can act, because you can finally see. The retriever is passing 120 candidate chunks at about 230 tokens each straight into context. Rerank those 120 and keep the top 15, compress each to about 120 tokens, and the retriever's context drops from 27,600 tokens to roughly 1,800. The run falls from about 41,000 tokens to about 15,200, a 63 percent cut, and the answer usually gets better, because the extractor is no longer reading 105 chunks it never needed. At a representative 3 dollars per million input tokens, that single run went from about 12 cents to about 5 cents. Multiply by 10,000 runs a day and it is the gap between roughly 449,000 dollars and 166,000 dollars a year on input tokens alone, about 283,000 dollars, found by one view that breaks the run down by span.
The point is not the retriever. The point is that without attribution you would never have looked there. The tempting move on a 41,000-token run you cannot see inside is to swap to a cheaper model and shave 20 percent at a real cost to quality. Attribution tells you the actual waste is a pass-through you can delete, and that you get to keep the better model.
You cannot store everything, so sample the right thing
Full semantic payloads are large, and this is the objection that stops teams from capturing them at all. An average run carrying about 44,000 tokens of prompt and completion text is roughly 180 kilobytes once you store it. At 10,000 runs a day, logging every run in full is about 1.8 gigabytes a day, over 50 a month, and the overwhelming majority of that is healthy runs nobody will ever open.
Sample structurally, not randomly. Keep 100 percent of the runs you would actually investigate, every failed run, every escalation, every run where a budget tripped or a loop was caught, call it 3 percent, about 300 runs. Add a 10 percent sample of healthy runs, about 970, kept only to keep the baseline honest. That is roughly 1,270 full traces a day, about 230 megabytes, an 87 percent reduction, and you did not drop a single run worth debugging. Random sampling is the wrong tool here, because it discards your failures at exactly the same rate it discards your successes, and the failures are the only runs you were ever going to read.
System metrics will never catch a wrong answer
Everything to this point makes the run visible. None of it tells you the answer was wrong, because "wrong" is not a system metric. The retriever's token count, the run's latency, the routing path, and the step count can all be perfect while the extracted figure is off by a decimal place. The only way to catch the silent wrong answer is to check the meaning of the output, continuously, on a sample. Run a rule check or an evaluator model over a slice of production traces, score them against the same rubric you used to evaluate the system in development, and alert when the score drifts down. This is not free, an evaluator model on 10 percent of runs is 10 percent more model calls, but it is the only instrument pointed at the failure that actually loses you customers, and it is far cheaper than learning about that failure from one of them.
Brakes stop a runaway. Instruments show it coming.
Chapter four extended the old picture of a wiring diagram versus a driver by giving the car brakes. This chapter gives it an instrument panel. You would not drive at speed with the windshield painted over and no gauges, trusting that the brakes will save you when you finally hit something, and a multi-agent system with control but no observability is exactly that car. The brakes are what stop the one-in-fifty runaway. The instruments are what let you see it building, attribute the cost, find the agent that broke, and prove the fix actually worked. They are two halves of operating the same system, and, like state and control before them, they run on shared wiring: the store you snapshot, the budget that trips, and the state you hash are each both a control signal and a telemetry event. Build them together, because retrofitting observability onto a system that was shipped blind means reconstructing runs you never recorded.
A single model call is observable by default: one input, one output, one number. Everything you add after the second agent, you have to instrument yourself, or you are flying blind and calling it production.
When you do not need any of this
The honest caveat, same as every chapter in this series. If your system is a single agent, or a low-volume internal tool where a wrong answer is caught by the one person who reads every output, the full apparatus is overkill, and the single-agent case is again the cheapest answer: one span, trivially observable, nothing to correlate. Observability earns its cost when runs are frequent enough that you cannot read them all by hand, non-deterministic enough that you cannot reproduce them on demand, and consequential enough that a silent wrong answer is a real liability. That is precisely document-heavy work in regulated domains, and it is also precisely where teams ship the black box and hope the demo holds.
We build production multi-agent systems for document-heavy work in legal, finance, and insurance, where a run that returns a confident wrong answer is not a curiosity, it is a filing error and a liability. If your agents work in the demo but you cannot say what they cost per run or where they go wrong in production, the missing layer is observability, not a better model. Talk to an engineer or see how we work.
Share this article
Multi-Agent Systems in Production
Topic Cluster
Orchestration, failure isolation, shared state and cost control — the engineering these articles describe, as an engagement.

Mudassir Marwat
Founder & CEO, Cognilium AI
Mudassir Marwat
Founder & CEO, Cognilium AI
Mudassir Marwat's argument is that ERP systems record decisions they never optimise.